QR Code Analytics for Scan Tracking & Campaign Reports Online
Use QR code analytics to measure scans, timing, devices, location trends, and campaign performance. Compare posters, packaging, menus, events, retail displays, and direct mail results.
Free QR code generator
Create a QR code online
Generate QR codes for websites, email, phone numbers, vCards, Wi-Fi, plain text, forms, PDF files, and campaign links. Customize colors, add a logo or frame, then download a print-ready PNG or SVG.
Choose QR code type
Website QR code, Email QR code, Phone QR code, vCard QR code, Wi-Fi QR code, Text QR code, SMS, WhatsApp, event, and download links.
Add your content
Enter your website URL, contact details, message, phone number, location, or file destination before generating the QR code.
Customize and download
Adjust QR colors, error correction, logo, frame, size, and margin. Generate QR Code, Download PNG, Download SVG, or Save and track scans.
Analytics reporting
Turn offline scans into campaign signals you can actually review
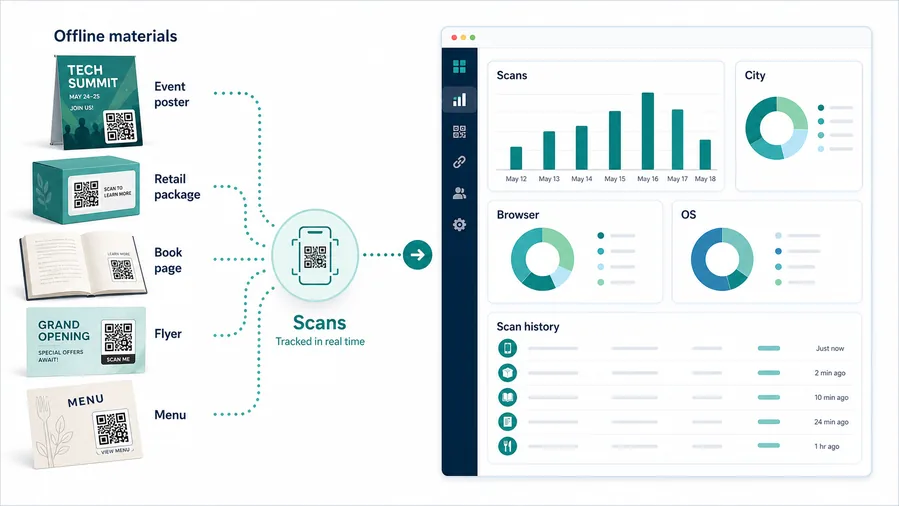
QR code analytics are useful when a printed or physical placement needs to be measured instead of guessed. With a trackable dynamic QR code, scans become events you can review: scan volume, scan timing, device patterns, browser or operating system signals, scan history, and approximate location trends where available. This helps connect offline materials to real user actions.
That data helps marketers, event teams, restaurants, retailers, agencies, and business owners compare real placements. A poster near the entrance may look obvious, but a receipt, table card, package insert, badge, shelf sign, or follow-up card may get more scans because it appears at the moment the person is ready to act. Analytics helps test those assumptions instead of arguing from taste.
Analytics do not magically prove revenue by themselves. They show scanner activity around a specific QR code. The useful habit is to give each important placement its own trackable code, keep names clear, and compare scans against the physical context: where the code appeared, what the call to action said, and what mobile page opened after scanning.
Scan reporting
Use QR analytics to compare campaign attention without overclaiming attribution
AnalyticsQR analytics are strongest when separate tracked codes help compare materials, placements, timing, devices, and broad location patterns across real campaign surfaces.
All scans collapse into one total
A single QR code can show overall interest, but it cannot tell whether a poster, handout, table card, package insert, email signature, or sales sheet produced the scan.
Use one shared code only when the team does not need placement-level comparison later.
Each placement becomes a measurable signal
Separate dynamic QR codes let you compare materials without changing the scanner experience.
The result is scan analytics, not full revenue attribution, but it is far more useful than guessing which asset earned attention.
Scan volume
Review how many scans each code received during the selected period and compare totals across campaign materials.
Time and device
Check when people scanned and which device, browser, or operating system opened the destination.
Broad location
Use approximate location signals to spot regional or placement patterns without treating them as exact identity data.
Code comparison
Compare separate QR codes side by side when campaigns, teams, locations, channels, or print materials need their own readout.
Campaign reporting
Compare scan volume by QR code, date range, device type, browser, broad location, and campaign placement.
Print placement review
Use separate codes for posters, table cards, packaging, handouts, sales sheets, and booths to see which placements earned attention.
Operational cleanup
Spot zero-scan codes, unexpected locations, device issues, or scans that continue after a campaign should have ended.
Destination testing
Check whether scans continue after a URL, PDF, menu, form, product page, or campaign destination changes.
Name codes by placement before launch
Analytics are only useful when code names match real campaign materials, locations, teams, channels, or products weeks later.
Campaign reading
Read scan data as a placement signal, not just a bigger number
A high scan count can mean strong interest, better placement, a clearer call to action, or simply more foot traffic. A low scan count can mean the code is hard to notice, too small, placed before the scanner has their phone ready, or connected to an offer that does not feel useful. The dashboard gives you the signal; the campaign context explains it.
For offline campaigns, separate QR codes are especially valuable. Use different codes for flyers, menus, packaging, posters, event signs, badges, direct mail, and receipts so the scan history does not collapse every touchpoint into one vague total. If everything shares one code, you may know scans happened, but you will not know which material earned them.
Review timing as well as totals. A spike after an event, a slow weekend pattern, or scans from one device type can suggest what to improve next: placement, CTA text, print size, or the mobile page behind the QR code. Good analytics reading is practical, not flashy.
Analytics scan UX
Check the scan path before trusting the analytics
Scan UXAnalytics are useful only when the QR scans cleanly, opens the intended destination, and uses separate codes for the placements or campaigns you actually want to compare.
The code opens without friction
Poster, flyer, package, badgeIf scan distance, contrast, lighting, or destination speed is poor, analytics will reflect friction as much as interest.
Test the real printed size and placement before reading scan totals as demand.
The dashboard matches real campaign materials
poster-lobby, flyer-frontdesk, package-insertUse names that make reporting obvious weeks later.
A scan total is less useful when nobody remembers where the code was printed or which team placed it.
The page matches the printed promise
Offer, menu, PDF, booking, formThe first screen after the scan should confirm the action people expected from the printed CTA.
Unexpected redirects, slow pages, or mismatched pages make analytics harder to interpret.
Use separate placements when comparison matters
One code per material, location, channel, campaign, team, or product gives cleaner analytics than one shared code everywhere.
Review after launch, not only at the end
Look for zero-scan codes, strange locations, device issues, broken destinations, and scans after a campaign ended.
Keep expectations modest
Use scan data to compare attention and timing, not to claim every downstream sale, signup, or customer action.
Better setup creates better data
Most QR analytics problems start before launch, when too many placements share one code or names do not match the real campaign plan.